
The system calculates, AI describes, a person approves
AI already supports the work in DiGi in two places. From the technical drawing it prepares the control plan, and it describes a machine's results so you can see where it loses the most and where to start making improvements. In both cases it prepares a proposal, and the decision stays with the process engineer and the manager.
The system calculates
Machine results come from data collected on the shop floor and are calculated by the system, not by AI. Every number in the report text is compared with those calculations.
AI describes and proposes
AI takes over the work that eats up time: it reads dimensions from the drawing and turns tables of results into plain text. It says what matters most, where to start and what the next step is.
A person approves
Nothing reaches the shop floor on its own. The process engineer checks the balloons and saves the control plan, and the manager decides what to do with the report. Until a person saves it, an AI proposal stays a proposal.
Two uses in two modules
Both eliminate repetitive work – with every new part and every analysis.
DiGi Smart Control · quality control
Auto-ballooning of drawings
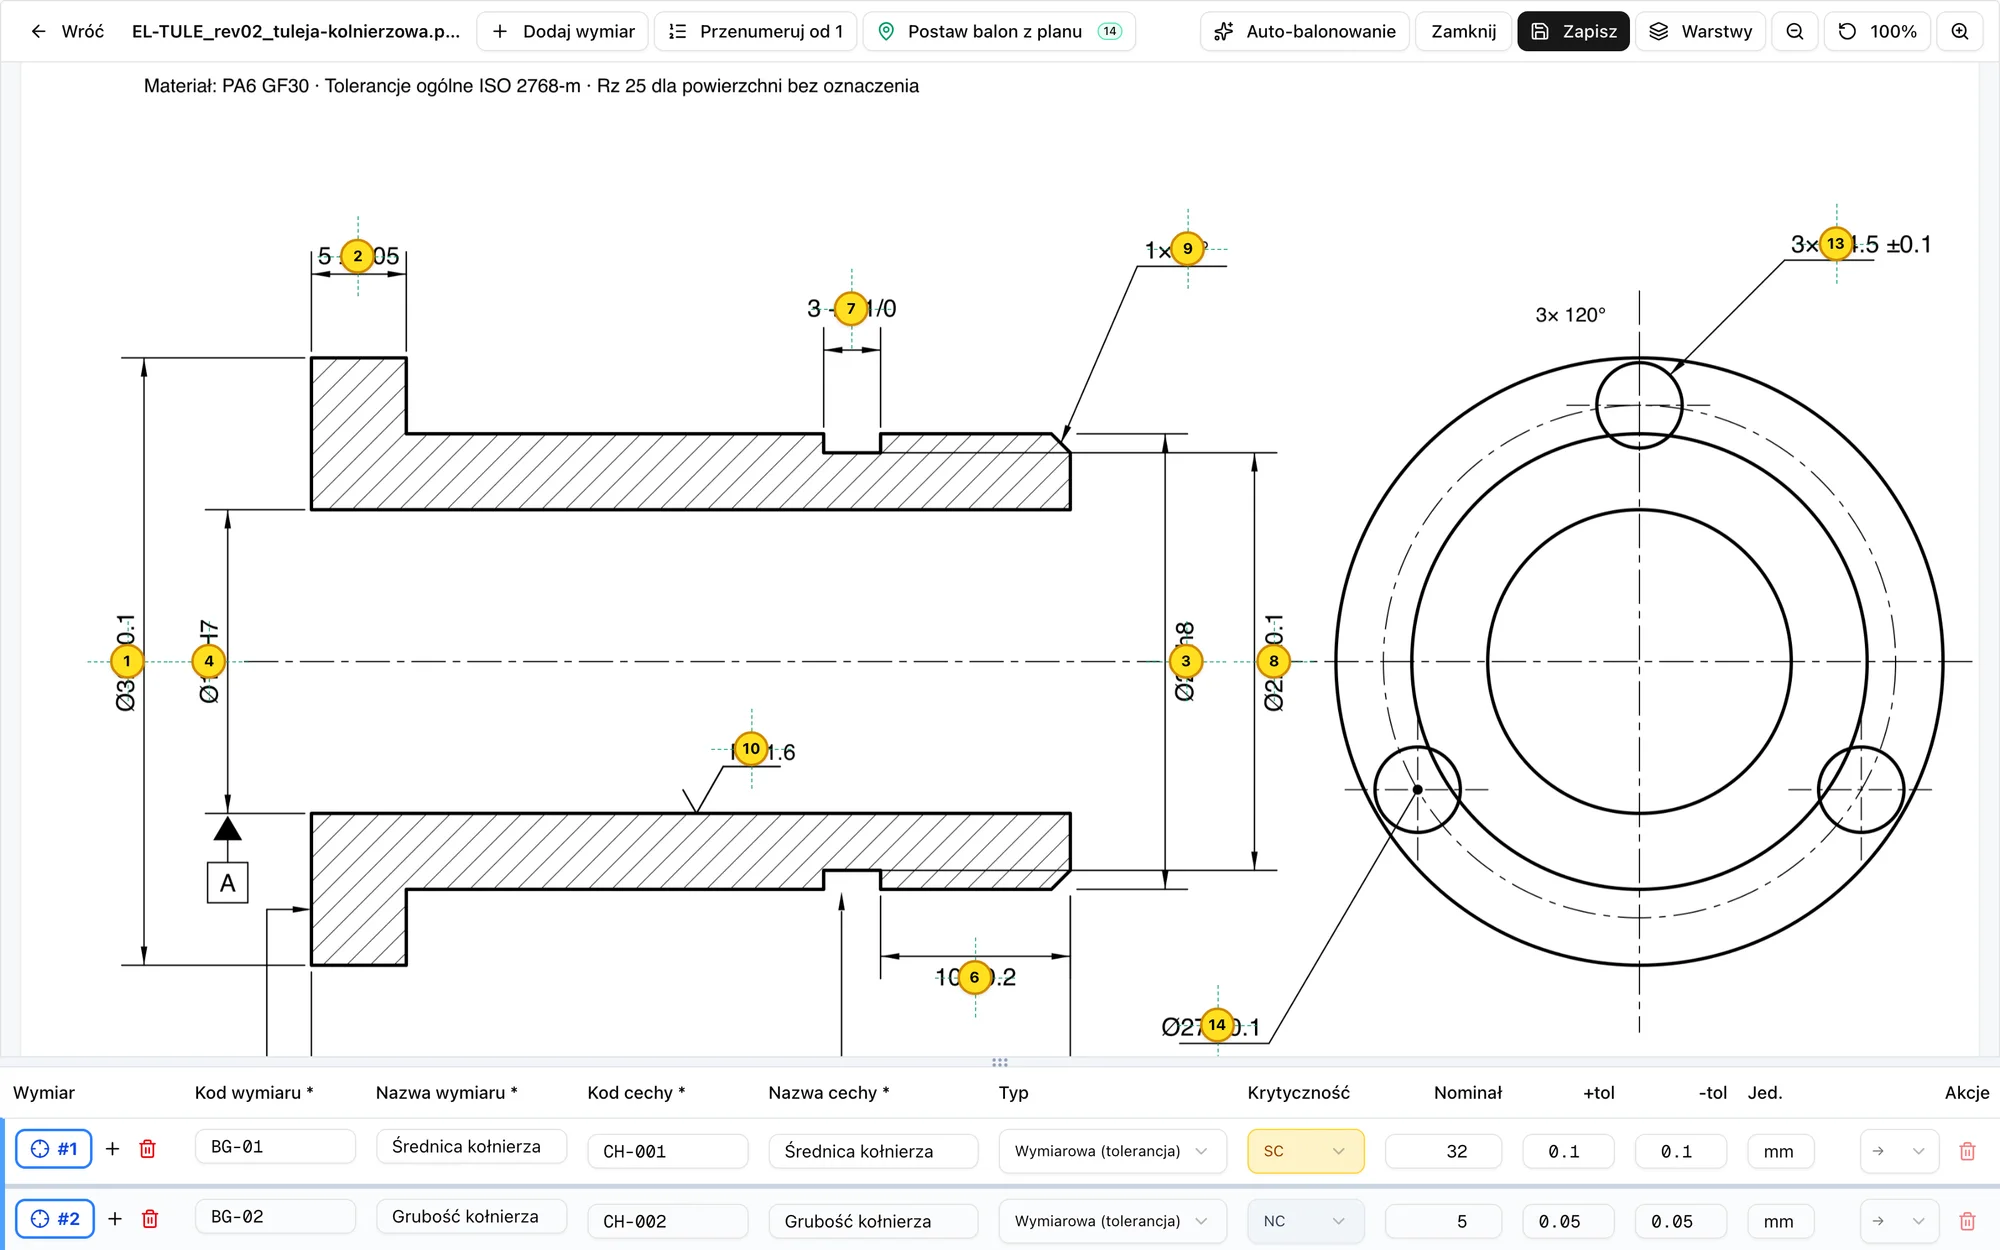
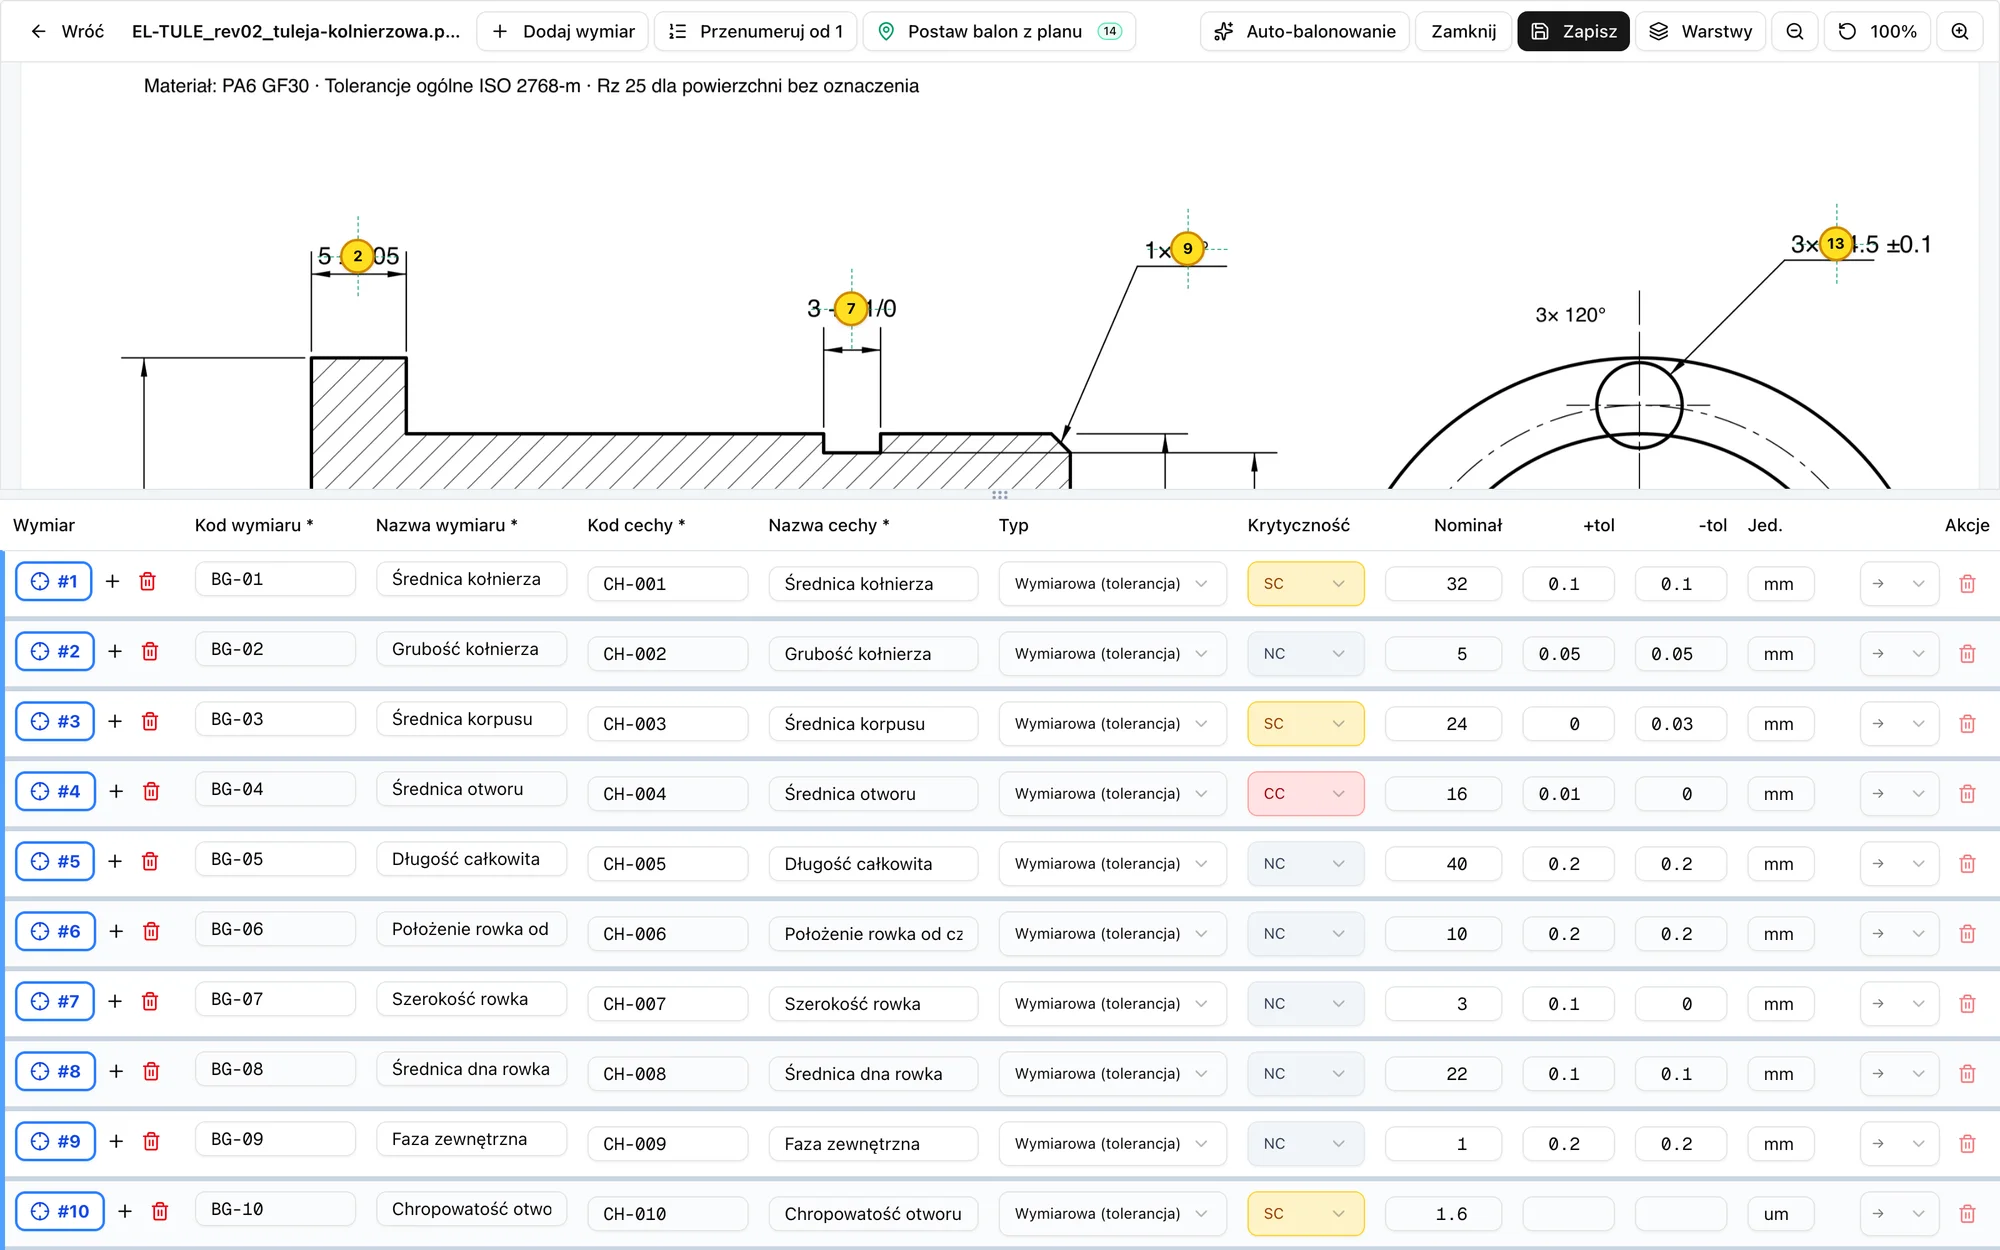
AI reads dimensions and tolerances from the technical drawing, places the balloons automatically and proposes characteristics for the control plan. The process engineer only verifies and approves the data.
Time saved: no more manual retyping of dimensions from the drawing into the control plan for every new part.
How ballooning worksDiGi Smart Monitor · production efficiency
Smart Reports
A comprehensive report for a chosen machine and period: the system converts losses into OEE points and detects patterns, and AI sets the priorities and points to specific corrective steps.
Time saved: no more digging through data by hand to work out where to start optimising.
How a report is madeFrom the technical drawing straight to the control plan
You upload the part drawing, and AI reads the dimensions and tolerances, numbers them with balloons and proposes a ready list of characteristics for the control plan. The same ballooned drawing later becomes a clear measurement instruction for the operator on the shop floor.
For: process engineer, quality department
How does it work in 4 steps?
- 1
You upload the drawing
You add a file in PDF, DWG, PNG or JPG format and attach it directly to the control plan of the part.
- 2
AI analyses the documentation
The system reads dimensions, tolerances, GD&T, surface roughness and special characteristics, and then places the balloons automatically.
- 3
It matches the data to the library
AI links the parameters it has read to the existing characteristics library in your company – without creating duplicates – and selects a suitable measuring instrument straight away.
- 4
The engineer verifies and approves
Readings with lower confidence go to a separate “To check” list. The operator sees the changes at the workstation only after the plan is finally approved.
AI learns and applies the rules of your company
The ballooning configuration is shared by the whole plant – with each new drawing the system needs fewer corrections.
- Your own plant rules: e.g. “Mounting holes = SC” or “Threads are checked with a gauge”.
- Intelligent learning: the system itself proposes new rules based on the earlier corrections made by the process engineer.
- Compliance with standards: automatic recognition and marking of special characteristic symbols according to the adopted standards.
- Measurement safety check: immediate warnings when the selected instrument is not accurate enough for the tolerance or its calibration has expired.
- Revision continuity: a new drawing revision automatically inherits the settings and links of the previous version.
A report that tells you plainly where to start
Smart Reports is a comprehensive analysis of how a chosen machine worked over a given period. The system calculates precisely how many OEE points each loss costs and in which areas it accumulates. On that basis AI generates a concise summary, sets the priorities and points to specific corrective steps.
For: production managers, management, maintenance department
After a changeover the machine often stops for adjustment
Evidence in the data
Stops with the reason “adjustment” accumulate in the first hour after a changeover – mostly on one shift.
Next step (organisational)
Compare the machine settings after a changeover between the individual shifts.
One part is produced below the standard on every shift
Evidence in the data
With this particular part the machine runs slower than the assumed rate regardless of shift and operator, while it keeps to the standard for the other parts.
Next step (in the system)
Verify whether the time standard assigned to this part matches what the machine can really achieve.
How is a report made?
You usually receive the finished document in about a minute.
- 1
You pick the machine and time range
You set the analysis period (from 28 to 365 days) and optionally add context – e.g. an overhaul, technological trials of a new part or a change of crew.
- 2
The system analyses data and detects patterns
The algorithm calculates the cost of each loss in OEE points, links related stops and identifies trends and accumulations on a specific shift, part or day of the week.
- 3
AI generates the report and the numbers are verified
You receive a summary, a list of priorities and next steps. Every value in the text is automatically verified against the hard calculations from the system.
- 4
You ask for details in natural language
You ask questions the way you talk on the shop floor – e.g. “Which shift has the most stops?” – and the system immediately calculates the answer from the report data.
What exactly does the report contain?
OEE summary
The OEE result for the chosen period broken down into availability, performance and quality – with the component that lowers the result the most.
Action priorities
A clear list of areas where it is worth starting the improvement, ordered by the cost of each loss in OEE points.
Findings backed by evidence
Each diagnosis includes specific evidence in the data, an assessment of pattern strength and a recommended next step – in the system or organisational.
Numbers that can mislead
Records caught distorting the statistics, such as changeovers left open or scrap registered without a reason.
Other observations
Processes that run stably, and small deviations that are currently too minor to involve the team.
Ready for print and PDF
The report saves the state of the data from the moment it was generated and is formatted for printing straight away – ready for the morning production meeting.
What process engineers and managers ask
Answers without promises the system does not keep.
See AI in DiGi live
We will show how AI balloons a drawing and how a Smart Report is made. A short online meeting is enough.

Piotr will help you pick the solution that fits your production processes.
Phone: (+48) 668 211 736
Email: contact@digi.com.pl